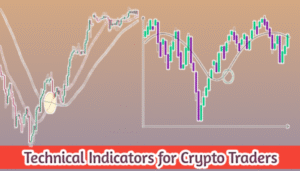
Technical Indicators for Crypto Traders Cryptocurrency trading is highly dynamic, volatile, and fast-paced. To succeed in this environment, traders rely on technical indicators — mathematical calculations applied to price, volume, or market data — to identify trends, entry and exit points, and potential reversals. Technical indicators are the backbone of technical analysis, helping traders make data-driven decisions rather than relying on emotions or guesswork.
1. What Are Technical Indicators?
A technical indicator is a statistical tool used to analyze historical and current market data. Traders use indicators to:
- Identify trends and market direction
- Measure momentum
- Detect overbought or oversold conditions
- Determine support and resistance levels
- Spot potential reversal or continuation patterns
Indicators are based on price, volume, or volatility data, and they help traders predict possible future price movements.
Important Note:
Technical indicators do not guarantee profits. They are tools to enhance trading decisions and reduce risk.
2. Categories of Technical Indicators
Technical indicators fall into three main categories:
- Trend Indicators – Identify the direction of the market.
- Momentum Indicators – Measure the strength or speed of a price movement.
- Volatility Indicators – Track market fluctuations and potential breakouts.
- Volume Indicators – Analyze the intensity of buying or selling pressure.
Many traders use a combination of indicators from different categories for confirmation.
3. Trend Indicators
Trend indicators help traders determine whether a crypto asset is in an uptrend, downtrend, or sideways market.
3.1 Moving Averages (MA)
A moving average smooths price data to identify trends over a specific period.
Types:
- Simple Moving Average (SMA): Average price over a set period.
- Exponential Moving Average (EMA): Gives more weight to recent prices for faster reaction.
How to Use:
- SMA crossover strategies: e.g., 50-day SMA crosses above 200-day SMA = bullish signal.
- Identify support and resistance levels during trending markets.
Popular Use:
- Spot long-term trends for BTC, ETH, or altcoins.
3.2 Moving Average Convergence Divergence (MACD)
MACD measures the relationship between two EMAs to identify momentum and trend changes.
Components:
- MACD Line = 12-day EMA – 26-day EMA
- Signal Line = 9-day EMA of MACD line
- Histogram = Difference between MACD and Signal Line
Signals:
- MACD line crossing above signal = buy
- MACD line crossing below signal = sell
- Histogram shrinking = weakening trend
Why It Matters:
MACD helps crypto traders spot trend reversals early, making it ideal for swing trading.
3.3 Parabolic SAR (Stop and Reverse)
Parabolic SAR is a trend-following indicator that shows potential trend reversal points.
How It Works:
- Dots appear above the price = bearish
- Dots appear below the price = bullish
Best For:
- Trend confirmation
- Placing trailing stop-losses
4. Momentum Indicators
Momentum indicators measure the speed and strength of price movements. They help traders understand if a trend is gaining or losing strength.
4.1 Relative Strength Index (RSI)
RSI measures the magnitude of recent price changes to detect overbought or oversold conditions.
Scale: 0–100
- Above 70 = overbought (possible sell)
- Below 30 = oversold (possible buy)
Use Cases in Crypto:
- Identify reversal points for BTC, ETH, or altcoins
- Combine with trend indicators for confirmation
4.2 Stochastic Oscillator
Compares a crypto asset’s closing price to its price range over a period.
Scale: 0–100
- Above 80 = overbought
- Below 20 = oversold
Signals:
- %K line crossing %D line can indicate buy/sell opportunities.
Popular With: Swing traders using 4-hour or daily charts.
4.3 Awesome Oscillator (AO)
AO measures market momentum using simple moving averages of midpoints.
How to Read:
- Green bars = bullish momentum
- Red bars = bearish momentum
- Crossover from negative to positive = buy signal
Best For:
- Short-term momentum trading in volatile crypto markets.
5. Volatility Indicators
Volatility indicators show how much a crypto asset’s price fluctuates, helping traders anticipate breakouts or market reversals.
5.1 Bollinger Bands
Bollinger Bands consist of a moving average (middle band) and two standard deviation bands (upper and lower).
Signals:
- Price touching upper band = overbought
- Price touching lower band = oversold
- Squeeze = low volatility, potential breakout
Why Traders Use It:
- Identify breakout opportunities in high-volatility coins like SOL, ADA, or DOGE.
5.2 Average True Range (ATR)
ATR measures price volatility over a given period.
How It Works:
- Higher ATR = higher volatility
- Lower ATR = lower volatility
Use Cases:
- Set stop-loss distances
- Adjust trade sizing based on market conditions
6. Volume Indicators
Volume indicators help traders analyze the strength behind price movements.
6.1 On-Balance Volume (OBV)
OBV adds or subtracts volume based on price movement.
Signals:
- Rising OBV = accumulation (buying pressure)
- Falling OBV = distribution (selling pressure)
Use Case:
- Confirm trends in BTC, ETH, or DeFi coins
- Identify early accumulation phases before price moves
6.2 Volume Weighted Average Price (VWAP)
VWAP calculates the average price of a crypto asset weighted by volume.
Why It Matters:
- Traders use VWAP as a benchmark for buy/sell decisions
- Large institutions often use VWAP to track fair price
7. Support and Resistance Indicators
Support and resistance levels help traders understand where price may stall or reverse.
7.1 Fibonacci Retracement
Fibonacci retracement uses horizontal lines based on Fibonacci ratios (23.6%, 38.2%, 50%, 61.8%) to identify key levels.
How to Use:
- Identify potential entry zones in uptrends
- Set stop-loss below key retracement levels
Popular For:
- Swing traders and position traders on daily or weekly charts
7.2 Pivot Points
Pivot points calculate potential support and resistance levels based on previous price data.
Signals:
- Price above pivot = bullish
- Price below pivot = bearish
- Levels used for intraday trading
8. Combining Indicators for Crypto Trading
Successful traders rarely rely on a single indicator.
Popular Combinations:
- MA + RSI – Identify trend direction + overbought/oversold conditions
- MACD + Bollinger Bands – Spot momentum + breakout potential
- Fibonacci + OBV – Entry/exit zones + volume confirmation
Rule of Thumb:
- Use 1 trend indicator, 1 momentum indicator, and 1 volume or volatility indicator for a balanced setup.
9. Tools and Platforms for Technical Indicators
TradingView
- Most popular charting platform
- Hundreds of built-in indicators
- Customizable alerts
Crypto Exchanges
- Binance, Kraken, Coinbase Pro provide built-in technical indicators
- Integrated charts for trading directly
On-Chain Analysis Tools
- Glassnode, CryptoQuant, Nansen for volume, network, and trend confirmations
10. Best Practices for Using Technical Indicators
- Understand, don’t memorize – Know how each indicator works.
- Combine indicators – Avoid overloading charts; 2–3 are enough.
- Backtest strategies – Test setups on historical data.
- Use multiple timeframes – Confirm trends on short and long charts.
- Adapt to market conditions – Some indicators work better in trending vs sideways markets.
- Manage risk – Indicators guide trades, but stop-losses and position sizing prevent major losses.
11. Advantages of Using Technical Indicators
- Provide objective data for decision-making
- Help identify trends and reversals early
- Allow precise entry and exit points
- Reduce emotional trading
- Compatible with automated trading bots
12. Limitations of Technical Indicators
- Lagging indicators react after price moves
- False signals in volatile crypto markets
- Require experience to interpret correctly
- Cannot predict unexpected news or market crashes
13. Common Mistakes Crypto Traders Make
- Using too many indicators (chart clutter)
- Ignoring the market context
- Trading solely on one signal
- Forgetting risk management and stop-losses
- Overtrading during low-volume periods
14. Takeaways
- Technical indicators are tools, not guarantees.
- Combining trend, momentum, volatility, and volume indicators improves decision-making.
- Scalping, swing trading, and long-term investing all benefit from proper indicator use.
- Always integrate indicators with risk management and trading discipline.
“Indicators illuminate the path, but traders walk it with knowledge, patience, and discipline.”